Skip links

Boost SMT Analytics

View data across SMT production lines

Analytics software on a laptop.

Boost SMT Analytics is a fully self-contained data collection system to help you calculate assembly line efficiency and productivity.

It’s designed to enable different machine types and brands to have their performance data recorded and displayed in a common form across an SMT production line setup.

BoostSMT Analytics can be used to examine:

Process Cost Analysis

Identify where is money being wasted and exactly how much money is being thrown away.

Component Usage and Wastage

See the real usage and which parts are causing the most problems.

SMT Process Monitoring

Clearly identify if targets are being met and know when will jobs be finished.

Machine Operation Performance

Get full visibility of machine errors are and if something is likely to fail before it happens.

Quality

Understand the yield from the SMT production line setup process and identify which parts are having assembly quality issues and why.

How it works with your SMT machines

Data is collected and converted to the SMX / XML / Binary database. Charts are then created by the user using the Linechart Analytics viewer modules to objectively display the data.

Charts can be displayed using a range of standard metrics across any number of SMT production line set-ups with any date range.

Data can be drilled down to a granular level and reported by the SMT machines it’s connected to.

Simple Navigation

Boost SMT Analytics is an advanced charting tool.

Simple drill down methods are used to get to the required chart details:

  • Select SMT Production Line to View
  • Select Chart type – i.e. CPH
  • Select Time Span
  • Drill Down to more detail

Chart Analysis

Always stay in control.

Use SPC tools analysis by machine and total line breakdown by the hour, shift, day, product, week, etc…

Set SPC limits, analyze trends, add action notes, add pictures and text to any chart or data type and view action notes wherever the subject data exists – in seconds.

BoostSMT Analytics chart of cycle time

Customization

The way data is presented can be fully customized.

Chart colors, chart types, text and pictures are all able to be displayed in multiple styles as required.

Further customization can be achieved using XML and style sheets. From any drill down any view can output to HTML, diagrams, charts, pictures, and text. Fully customized HTML charts will be displayed.

Customize interface

Slide Shows

Any combination of charts can be displayed as an impressive slide show.

This is typically displayed on a large screen for employee information or client impressions.

Transitions are settable for Scroll, Sweep, Reveal or Fly-through slides.

How it’s used

Analyze SMT Production Line Data Online or Offline

A powerful dynamic onsite tool

SMT machines can be active and provide real-time data updates periodically to achieve greater efficiency across your manufacturing assembly line.

Or used for remote analysis

Data files from a line can be sent independently over a given time slice and compiled very quickly for analysis in an offline mode. The data can then be stitched together over time.

Analyze SMT machine productivity and efficiency

Productivity

Understand how many hours per day, shift, month your SMT assembly lines are building your products.

Compare shifts of the day and how they impact productivity and identify the bottlenecks.

Efficiency

Optimise the efficiency of an assembly line. Understand how well your SMT production lines operate relative to the theoretical production estimate.

Linechart Analytics gives you the ability to define the theoretical estimate, and then monitor your actual performance relative to this estimate. Take the next step and apply SPC analysis to gauge your performance.

Chart Observing Line Balance

View key KPIs across your SMT manufacturing process

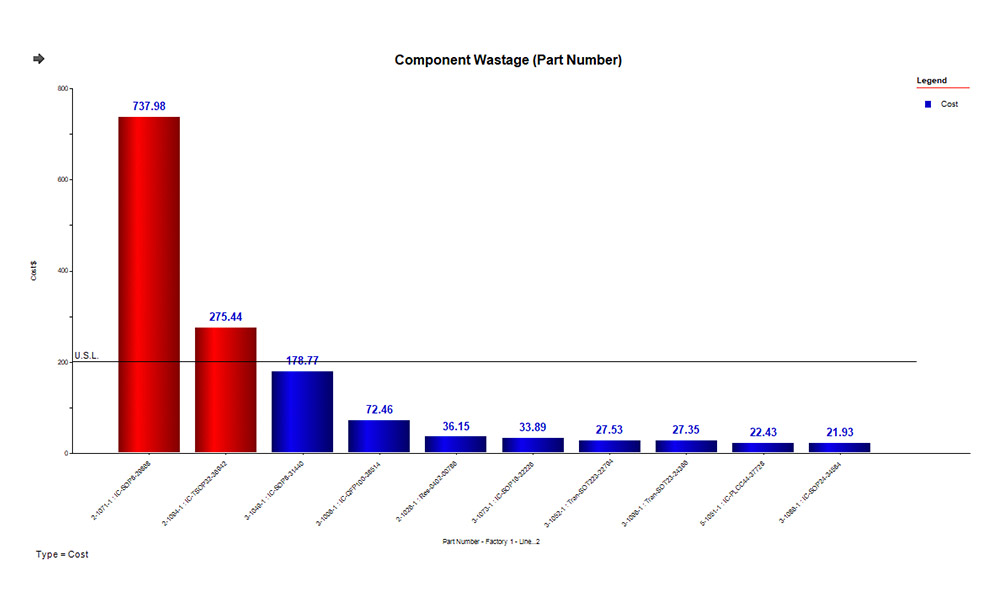
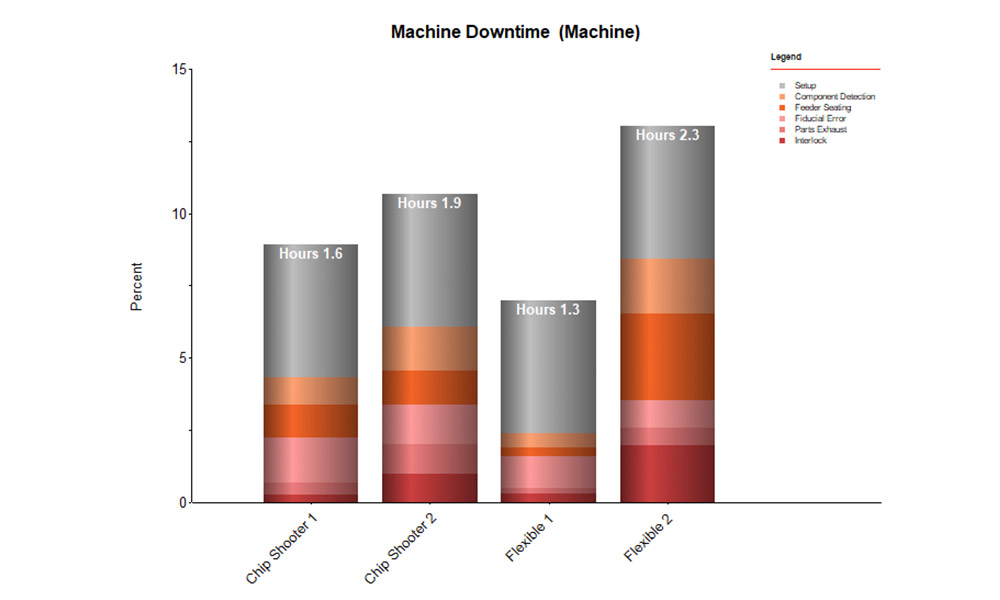
Miss-picking or rejecting components in your SMT manufacturing process directly affects your bottom line.

Linechart Analytics enables you to know where to focus your resources to control waste.

Analyze the data as Percentage Error, Count $ Dollars, View Component Wastage by Production Line Machine Part Number Error Type.

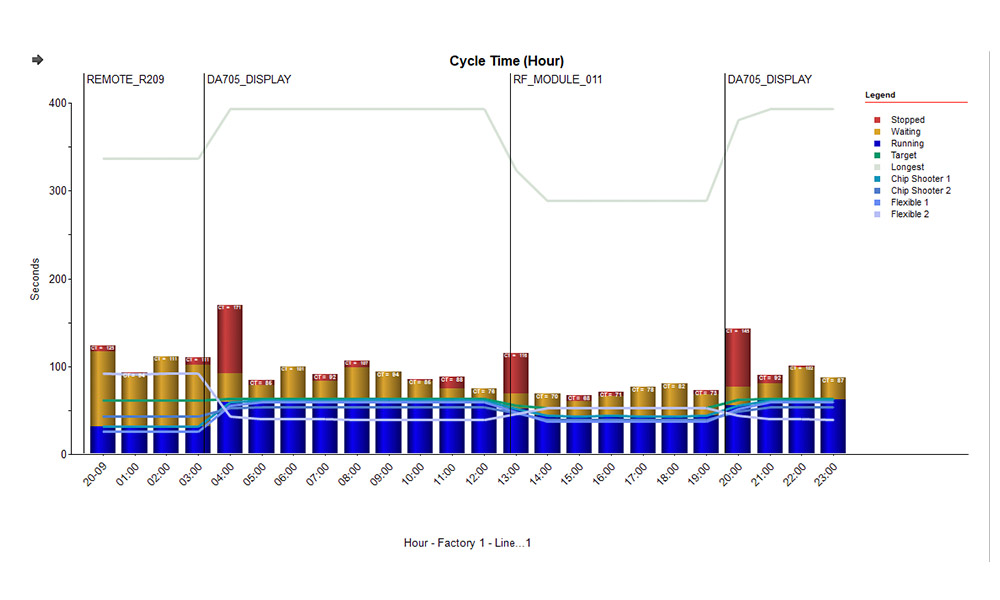
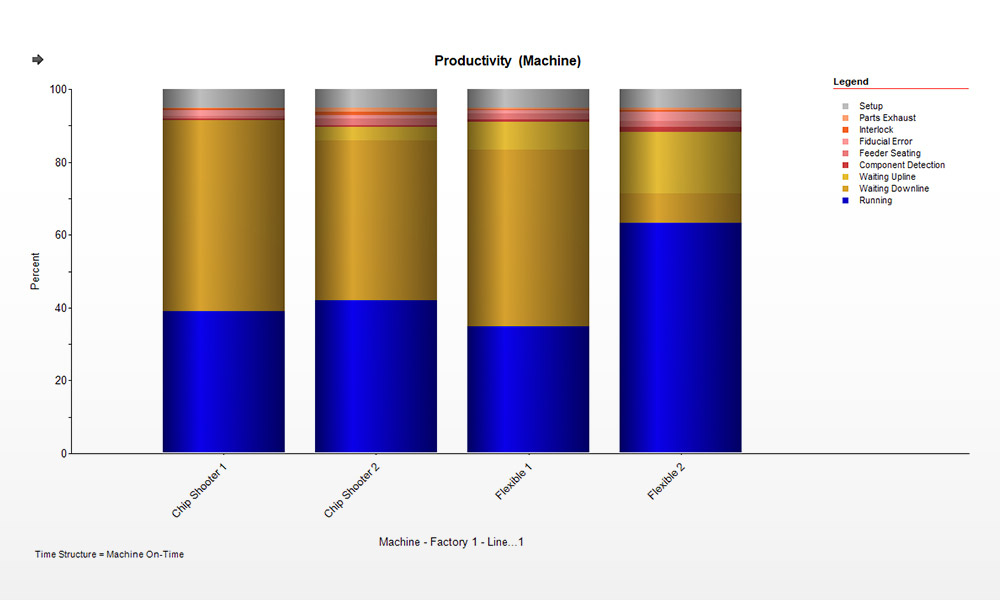
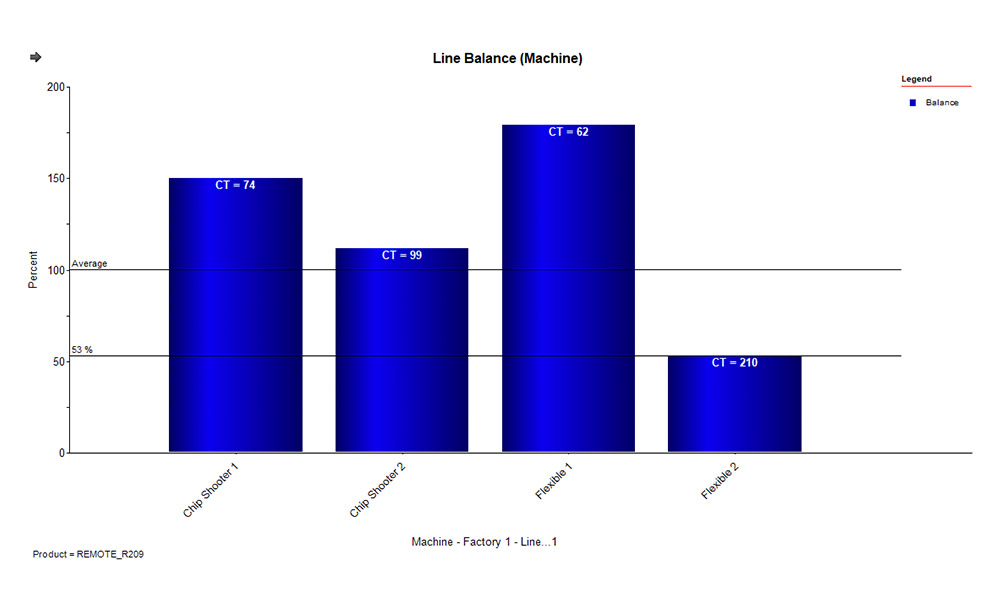
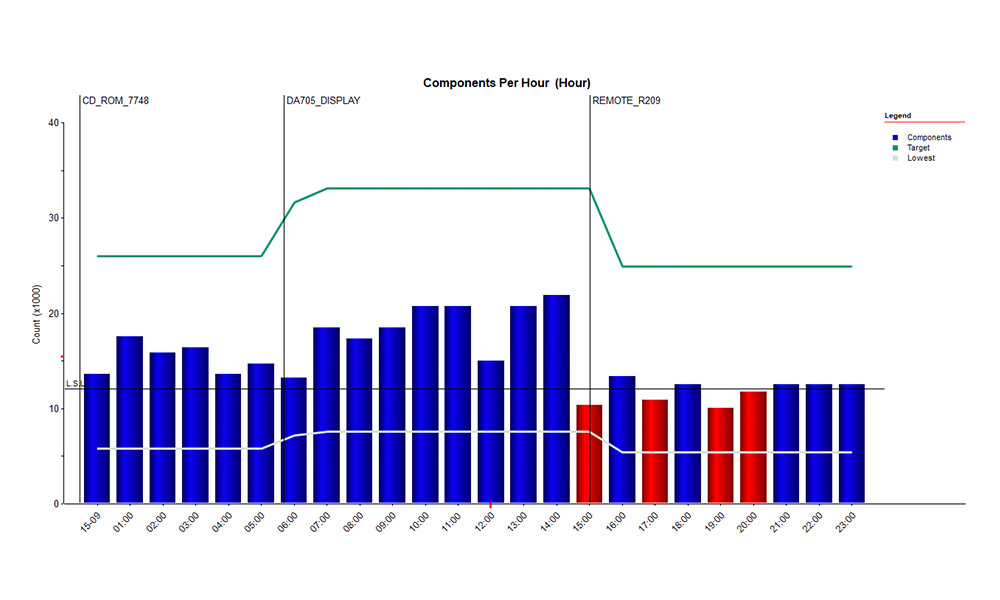
Monitor a lines CPH output and summarized performance. Be aware of non-productive time by the hour, shift, day, week, etc…

Generate reports over time to elevate awareness of your operation’s efficiency and raise alerts when performance targets are not being met.

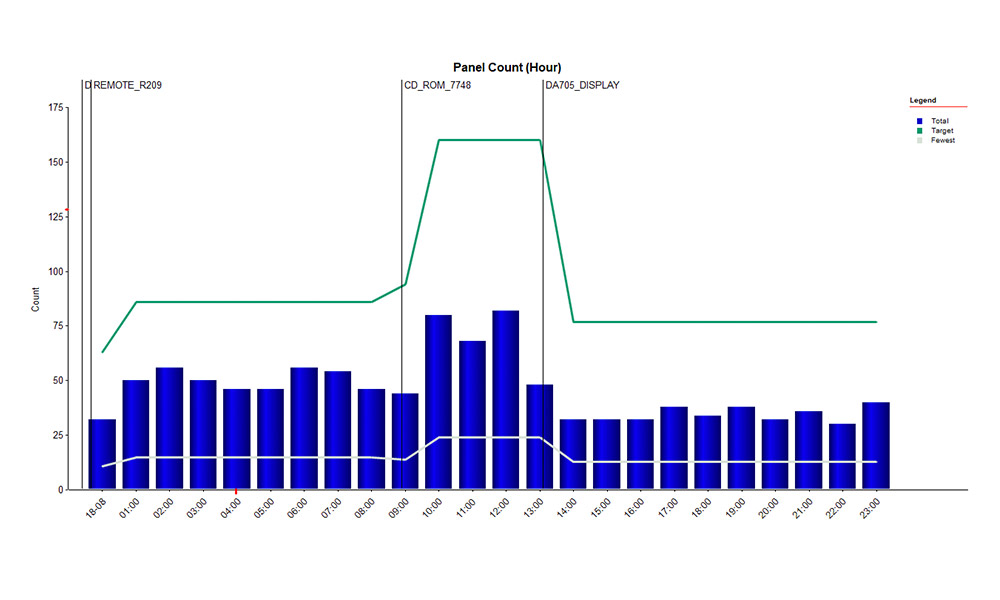
Analyze how many panels you’ve built over time, by product, by day, week or hour.

View SMT machine data and review data together to easily see false calls on AOI SPI X-Ray Manual Inspection Stencil Printers.

Understand how good your SMT assembly line process is for overall quality AOI SPI X-Ray Manual Inspection Stencil Printers.


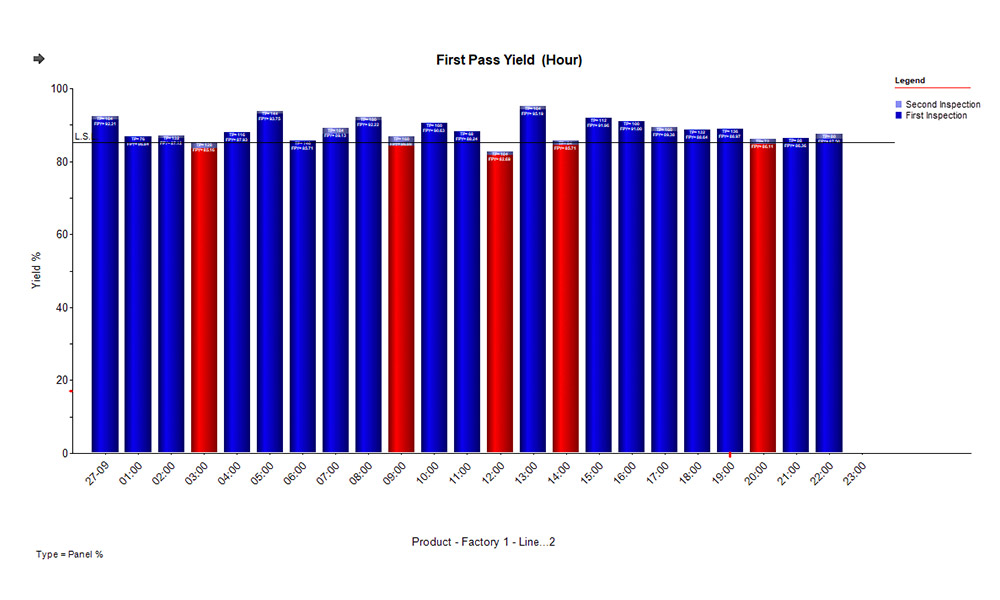
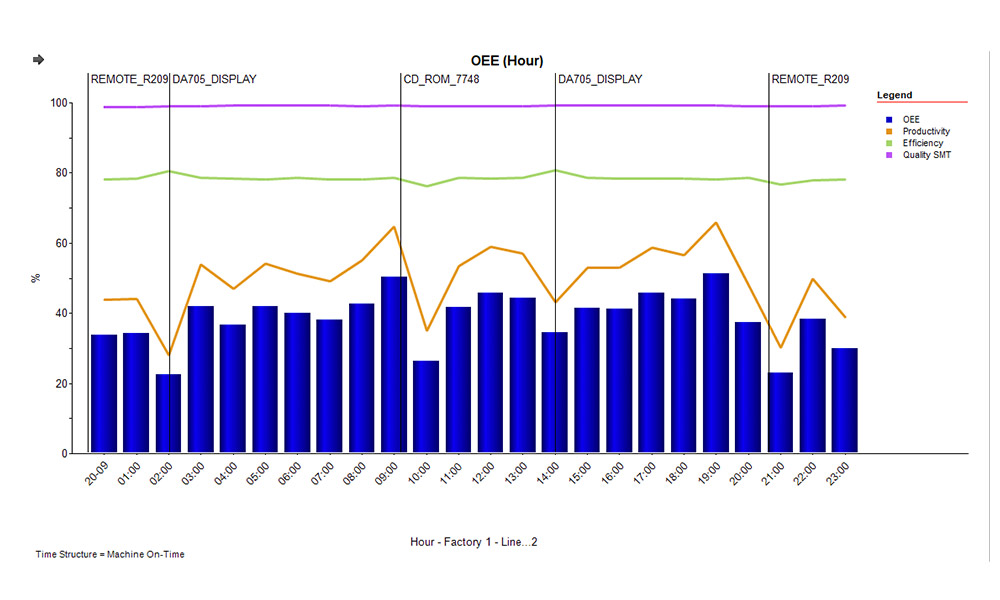
This metric allows you to get an overall view of how well your production is running by combing productivity, efficiency and quality metrics into one chart to analyze over time, by product, by day, or week.


SMT machines that BoostSMT Analytics supports:

BoostSMT Analytics Summary

Explore
Drag